• svg
  • svg
thumb

CSI ITALIA SRL

Galleria San Marco 4 33170 Pordenone Italy Phone +39 0434 28465

Have a question?

Please get in touch for more information

* Please Fill Required Fields *
img

Working Hours

We are happy to meet you during our working hours. Please make an appointment.

VIS Concrete Design Program – Ouput

By vis In Videos

20

Apr
2020

While the result of all engineering work is the final object (or structure) being built, what really comes out of an engineering office are documents: Calculation Reports, Drawings and Specifications.

Good documents mark our professionality. VIS will help with Reports and Drawings.

Calculation Reports are a fundamental tool for keeping track of what was done. They can also be used later for reviews and evaluation of our work.

Calculation Reports are very personal. You have a million ways of creating one using VIS. We suggest you assemble the various output items in a manner that is special to you and explains your design precisely.

There are many of these single bits of design output at your disposal. Here are some:

3D pictures of the overall structure or of its parts. 3D pictures can be wireframe or extruded. A few pictures with member labels will be of great help.

All sorts of diagrams, explaining your calculations. PMM interaction, either 2D or 3D; wall forces, as from analysis or amplified for capacity; ellipses of inertia; and so on.

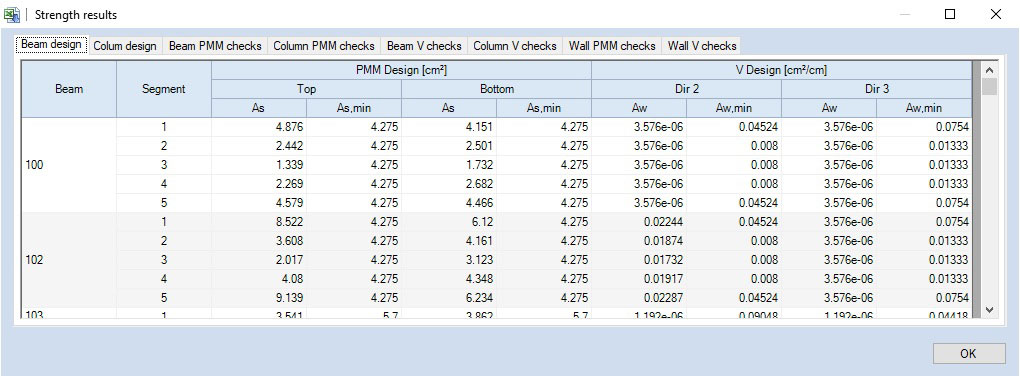
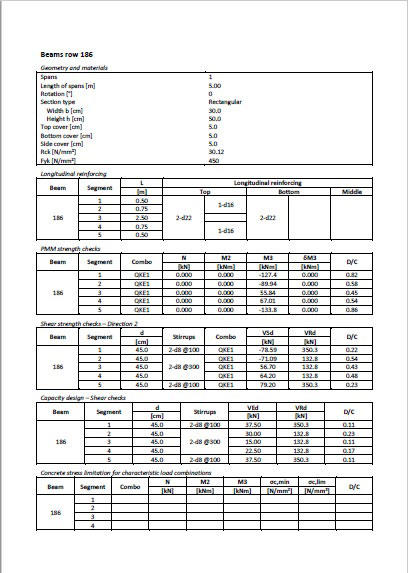
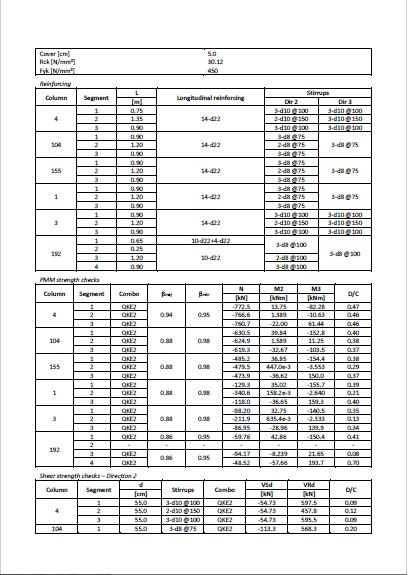
Beautiful spreadsheets with Tables of Results. They are grouped for type of member and type of design.
Color coded pictures of the structure, showing usage ratios for each member, as resulting from your calculations.
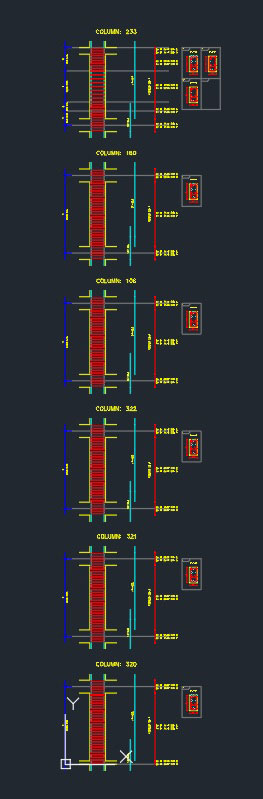
Drawings and sketches of section and elevation reinforcing.

All these outputs can be readily exported to a Word or Excel file and form your report. Just compile them as you like and add comments.

For those of you too lazy to do that, there is an option for the automatic report generation. Just select the elements you want to be included, choose the units, and click here. This report will necessarily be rather basic, but, again, you can improve it by adding pictures, diagrams, and comments.

Let us talk now about drawings. Here the approach is different, in that VIS does not generate complete project drawings.

There is, however, a mess of information, graphical and numerical, that VIS will generate and can be incorporated into these drawings. Sketches of all reinforcing can be exported in the DXF or DWG formats. These sketches can refer to a single member or to groups of members arranged in rows.

Numerical information on length and size of all rebars can also be exported.


Starting from here, a draft person can easily build the final drawings, integrating the new material into the larger project picture. At the same time, he will be able to retain control of drafting approach and format.

If you would like to know more about VIS

Contact us on info@vis-concretedesign.com, or see our youtube channel.

Leave a reply

Output…

By vis In

An automatic Calculation Report can be generated once design is complete. This can be done for the entire model or for selected concrete members. Drawings of reinforcing can be passed to the drafting board, via dxf or dwg files. For a more customized approach all results can be exported individually for subsequent use. They include tables, diagrams and drawings:
Summary of Results tables for Strength, Capacity, Serviceability and Detailing provisions

These tables can be copied and pasted to Excel spreadsheets and are kept updated while the user runs additional design/checks. Design tables provide minimum design areas for longitudinal and transverse reinforcing.  Check tables provide Demand Capacity ratios from PMM and V checks of worst load conditions for all members, including frame segments, wall sections, and beam-column joints.

Color coded graphics with summary of results

Demand/ Capacity ratios for all checks are represented with a color-coded graphic display of the structural model. Where failure occurs, members are rendered in red.

Frame internal forces tables

Internal forces tables for each element can be copied and pasted to Excel spreadsheets. 

2D Interaction diagrams


Interaction diagrams can be exported in EMF format (vector graphics used by Microsoft Word and other software). These are PM and MM interaction diagrams obtained during checks of single frame elements. 

Interaction curves tables


Tables with point coordinates of interaction curves can be copied and pasted to Excel spreadsheets. They can be obtained clicking the “Copy” button during checks of single frame elements. 

Export of complete input and output data tables


From the “File” menu by clicking the “Export” button, complete data tables for the model, including internal forces as well as design and check results can be exported to Excel or XML files. Note that these results occupy a single, very large worksheet. 

Screen catches


Screen catches of reinforced sections, 3D interaction diagrams, color-coded graphics of results, Ellipses of Inertia, and all other figures generated by VIS, can be obtained using the Alt-Stamp button combination from the keyboard.

Elevation and section drawings of reinforcing

Longitudinal and transverse reinforcing layout of selected columns, beams and walls can be viewed and exported to dxf or dwg files. Lap splice dimensions are program calculated based on code provisions.

and much more…

Outputs | VIS Concrete Design Software
click to enlarge
Outputs | VIS Concrete Design Software
click to enlarge
Outputs | VIS Concrete Design Software
click to enlarge
Outputs | VIS Concrete Design Software
click to enlarge
Outputs | VIS Concrete Design Software
click to enlarge

VIS Youtube Channel

See VIS Concrete Design Software in action when you visit our Youtube channel.